Raw WS input (wsraw_stats)
Objectives
Visualize the unscaled raw input being received by the Vision-RTK 2.
Evaluate the quality of the received measurements and verify that most are healthy.
Assess if the selected input frequency is sufficient.
Determine if the step size for the encoders or input stream is good for the selected platform.
Explanation
The raw wheelspeed input statistics file allows the user to evaluate the unscaled raw measurements streamed to the Vision-RTK 2 and assess the quality of these measurements, verify that the selected input frequency is sufficient, and determine if the step size for the encoders or input stream is good for the chosen platform. It serves as an additional aid to the user when an error is suspected after reviewing the ws_stats.html file. Two plots are generated for every configured wheelspeed sensor: The first plot presents the input velocity in all three dimensions, while the second plot shows the valid measurement flag status. Lastly, the file will contain a frequency plot if wheelspeed measurements are inputted using the FP_B-MEASUREMENTS message.
For more information on streaming wheelspeed measurements to the Vision-RTK 2, please refer to Section 5.8 of the Integration Manual.
Expected results
Velocity Plot: The user is presented with each auxiliary sensor's raw, unscaled input velocity vector on a per-axis basis. This plot serves to evaluate the resolution of the wheelspeed measurements, the frequency at which they were streamed, and the quality of the speed estimation.
Measurement OK Plot: All measurements sent to the Vision-RTK 2 should be valid under ideal conditions. Otherwise, this could hint at an incorrect frequency configuration or garbage messages being sent to the same port. In reality, some messages are sent with missing data or noisy measurements from the encoder that should be ignored.
The file displays all axes of the velocity vector regardless of whether they are enabled to be used by the Fusion engine. Make sure to enable all desired axes on the Web Interface.
Examples
In the first example, we observe a platform moving in a straight line over rocky terrain, receiving X and Z velocity measurements from an RC sensor. As shown in Fig. 1, as the sensor is mounted on the robot facing forward (x-direction), all received velocity measurements in the X-axis are positive. Moreover, we observe that these values have a good resolution and reach a constant value when the robot moves as it has a configured maximum velocity. In this case, the input velocity values in the Z-axis correspond to bumps caused by the rocky terrain during operation.
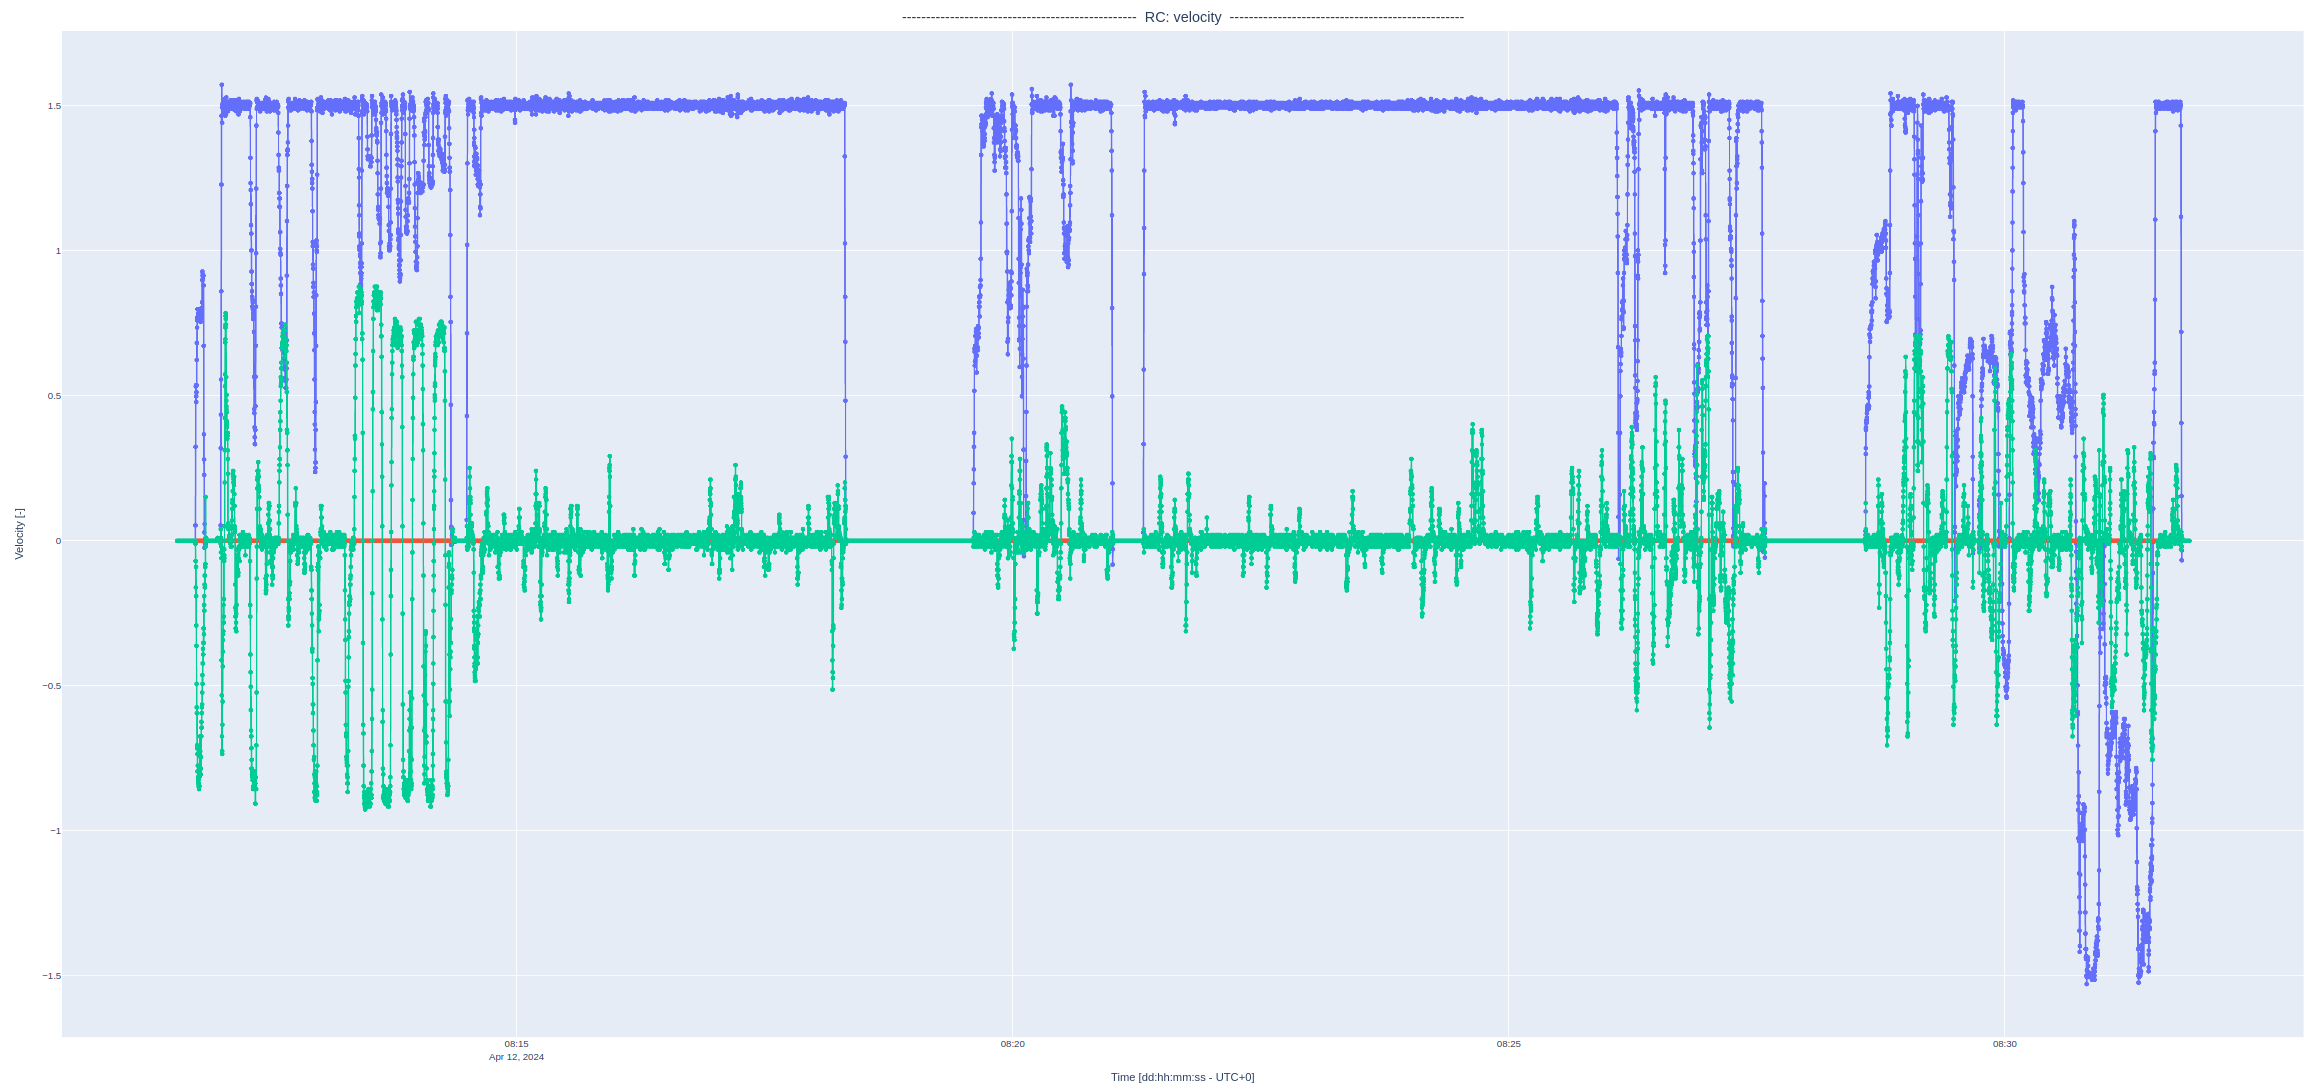
Fig 1: Input X and Z velocities on a vehicle moving in a straight line over rocky terrain.
As shown in Fig. 2, most input measurements are valid. However, by the end of the recording, the vehicle’s encoders were noisy due to the constant bumping of the road, which caused some measurements to be rejected by the Vision-RTK 2.
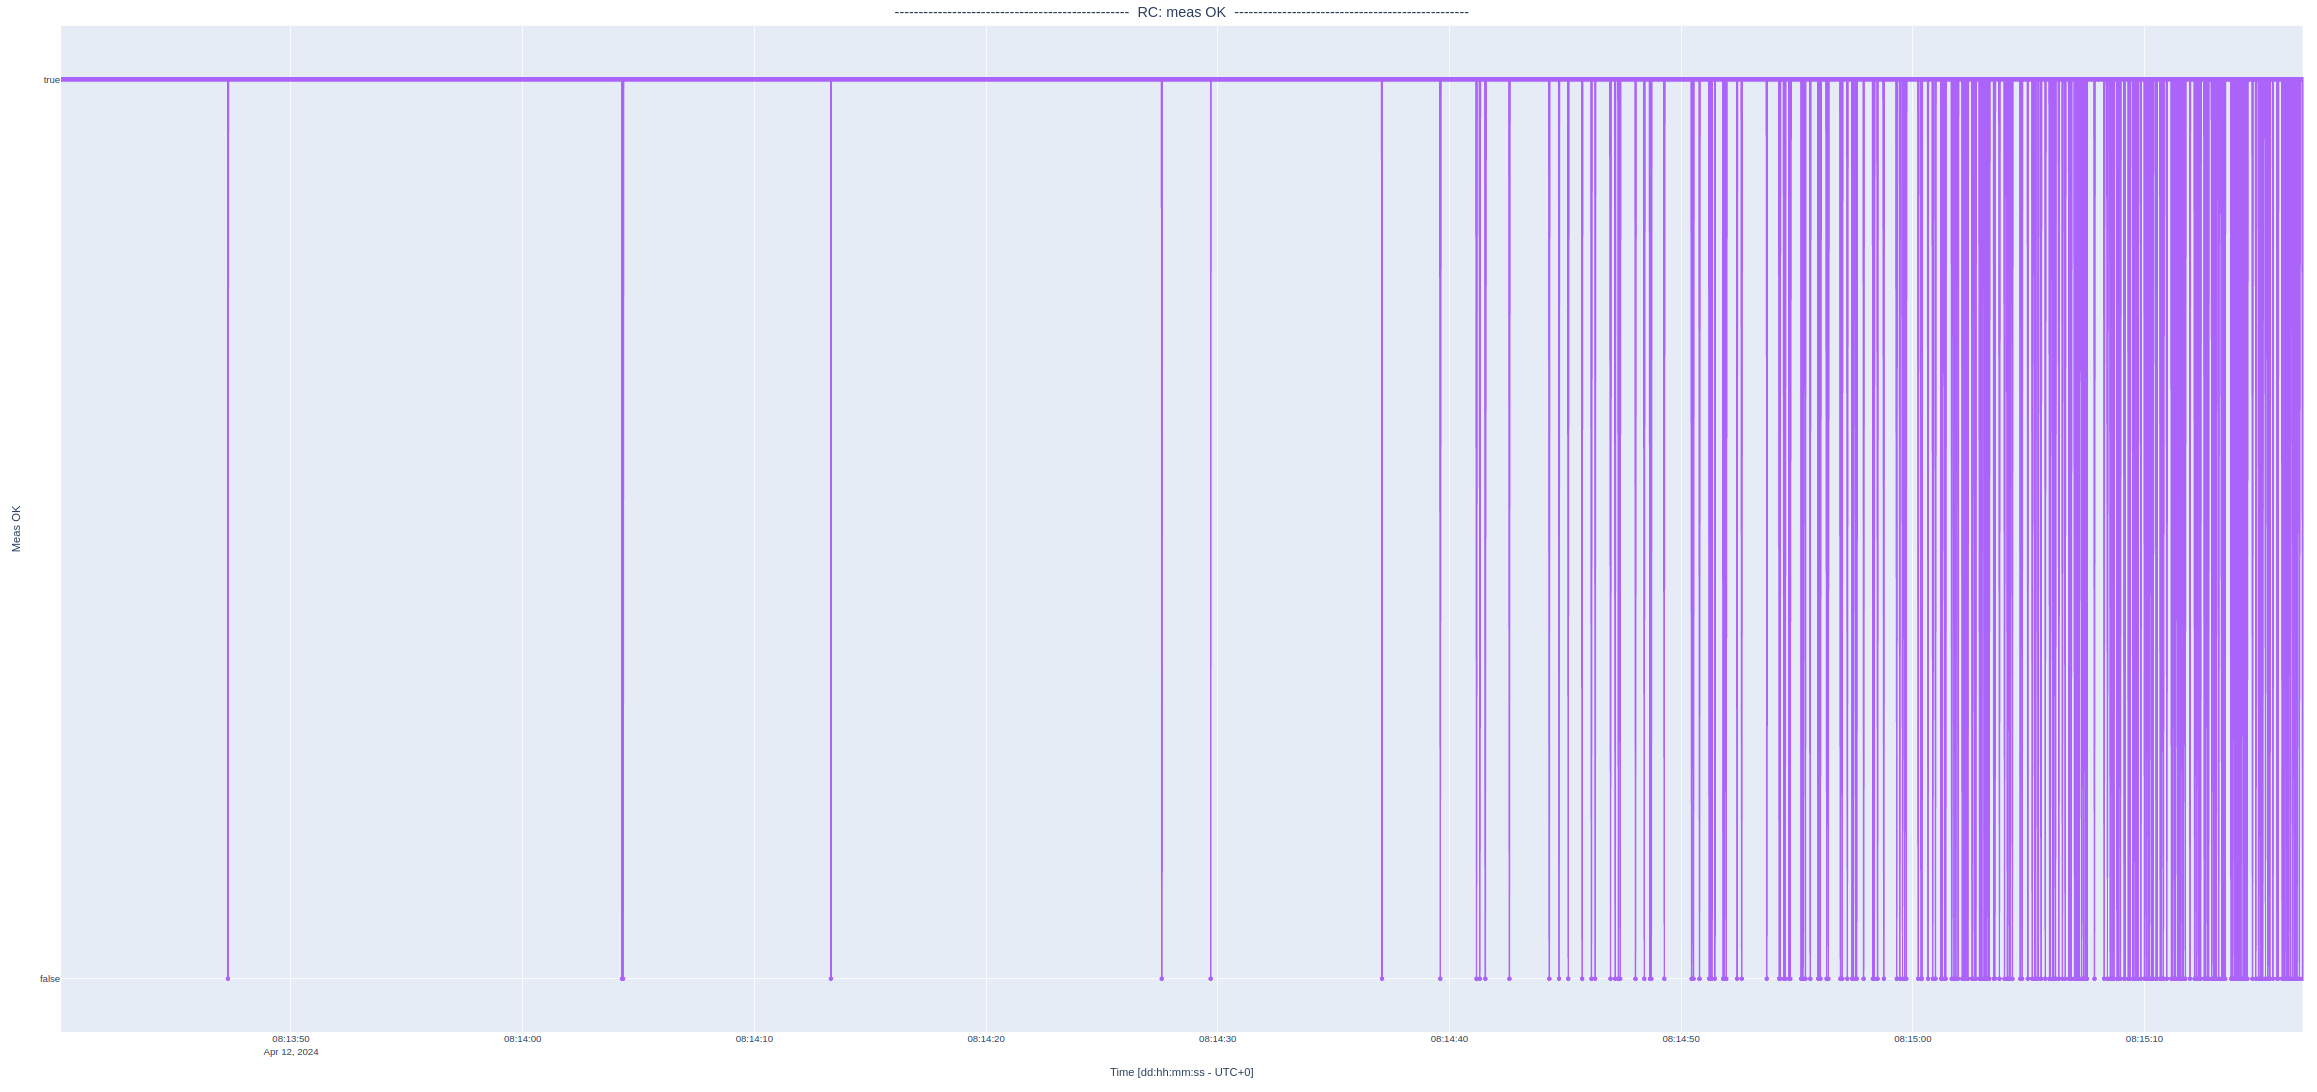
Fig 2: Measurement OK plot on a vehicle moving across a bumpy road.
In the second example, we observe a case where the user did not configure the input messages correctly. In this case, as shown in Fig. 3, the velocity in all three axes is always zero. In other words, no velocity input was extracted from the input messages.
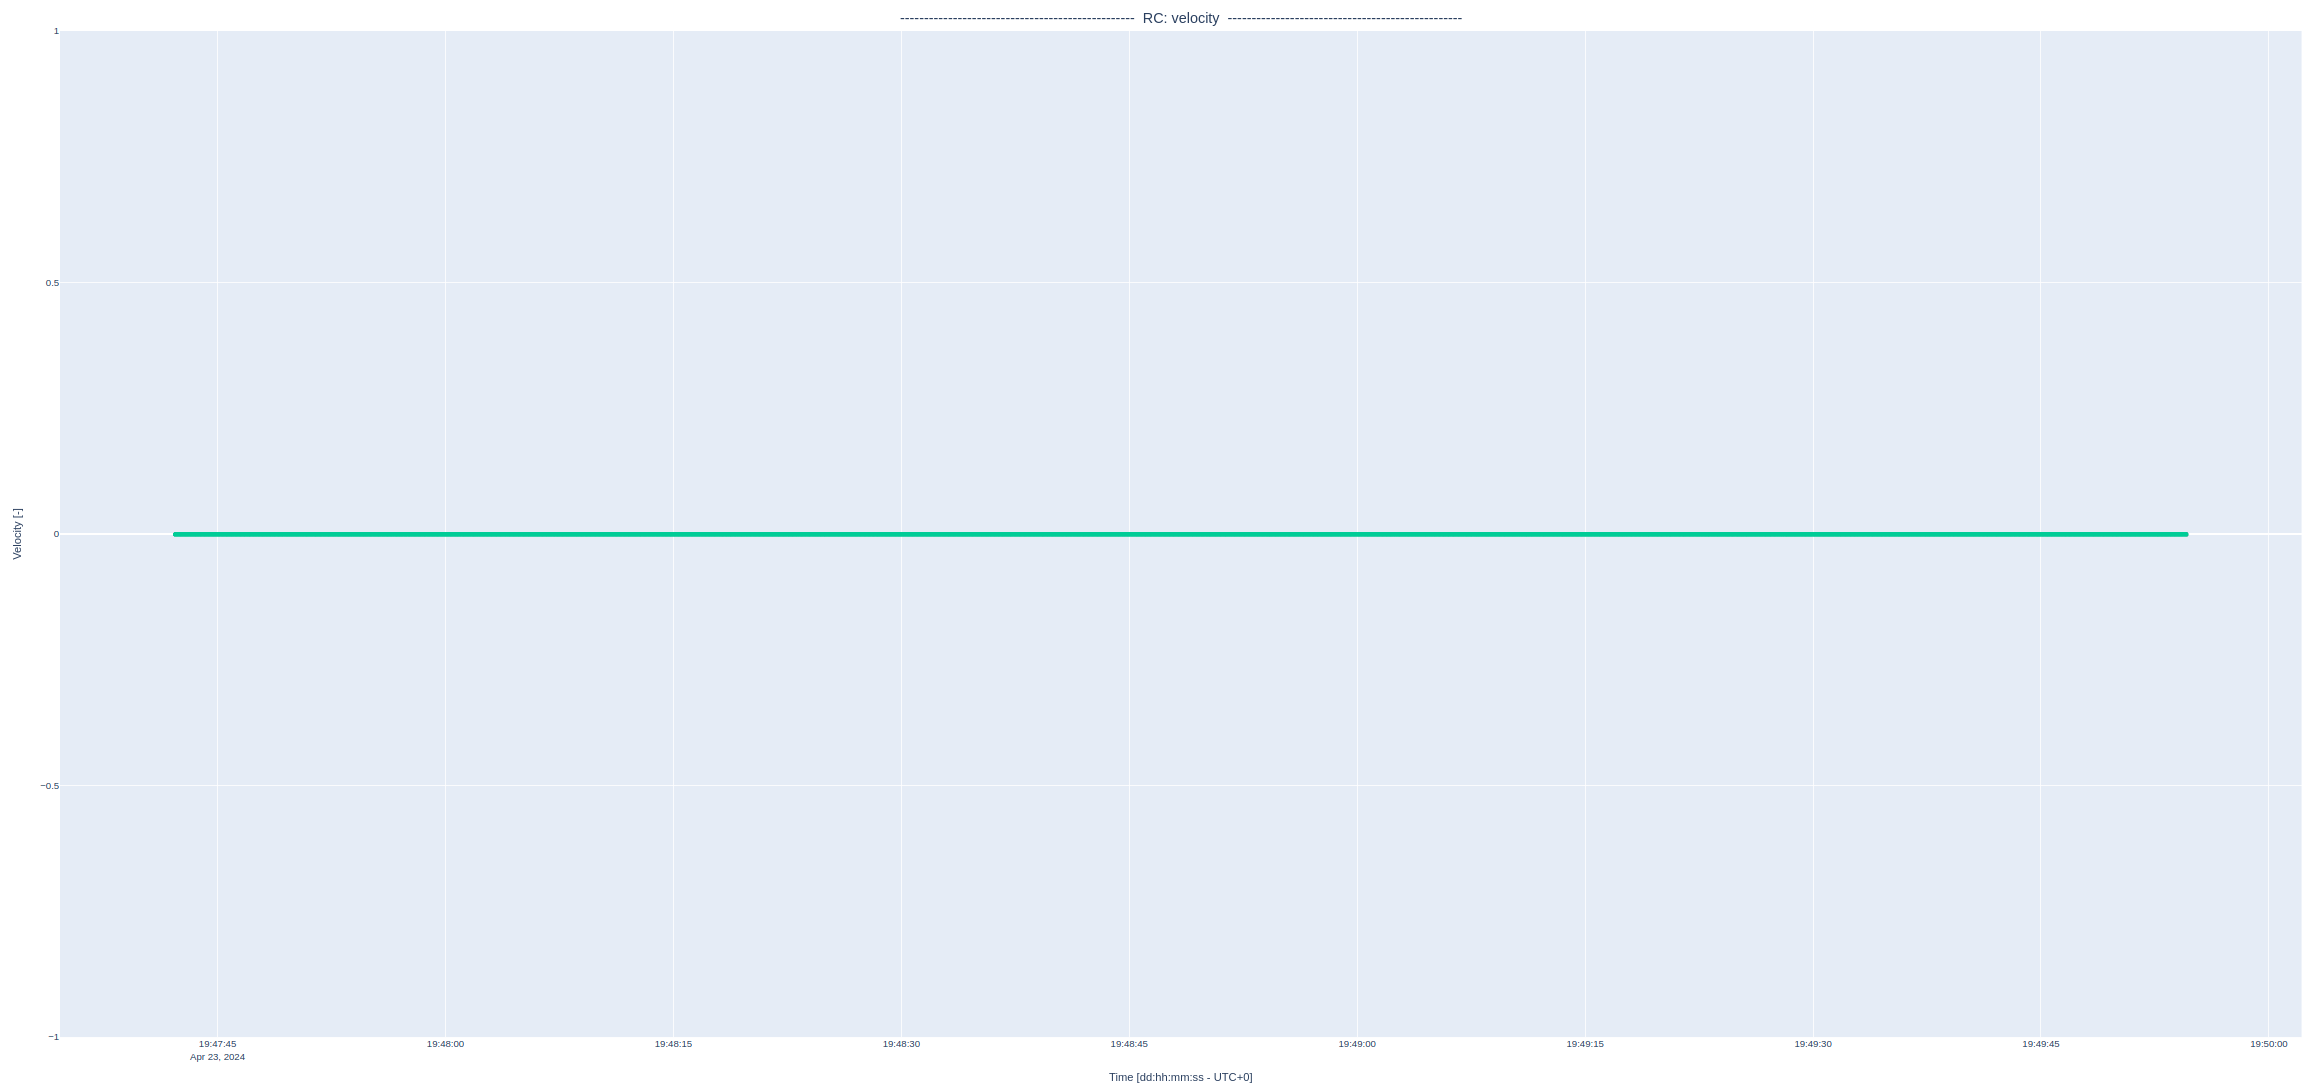
Fig 3: Velocity plot on a sensor with wrongly populated velocity fields.
On another note, the input messages are not being rejected by Vision-RTK 2, meaning that the message's composition is usually valid. Most likely, the user did not populate the velocity fields correctly, leaving the default value of zero in the input vector.
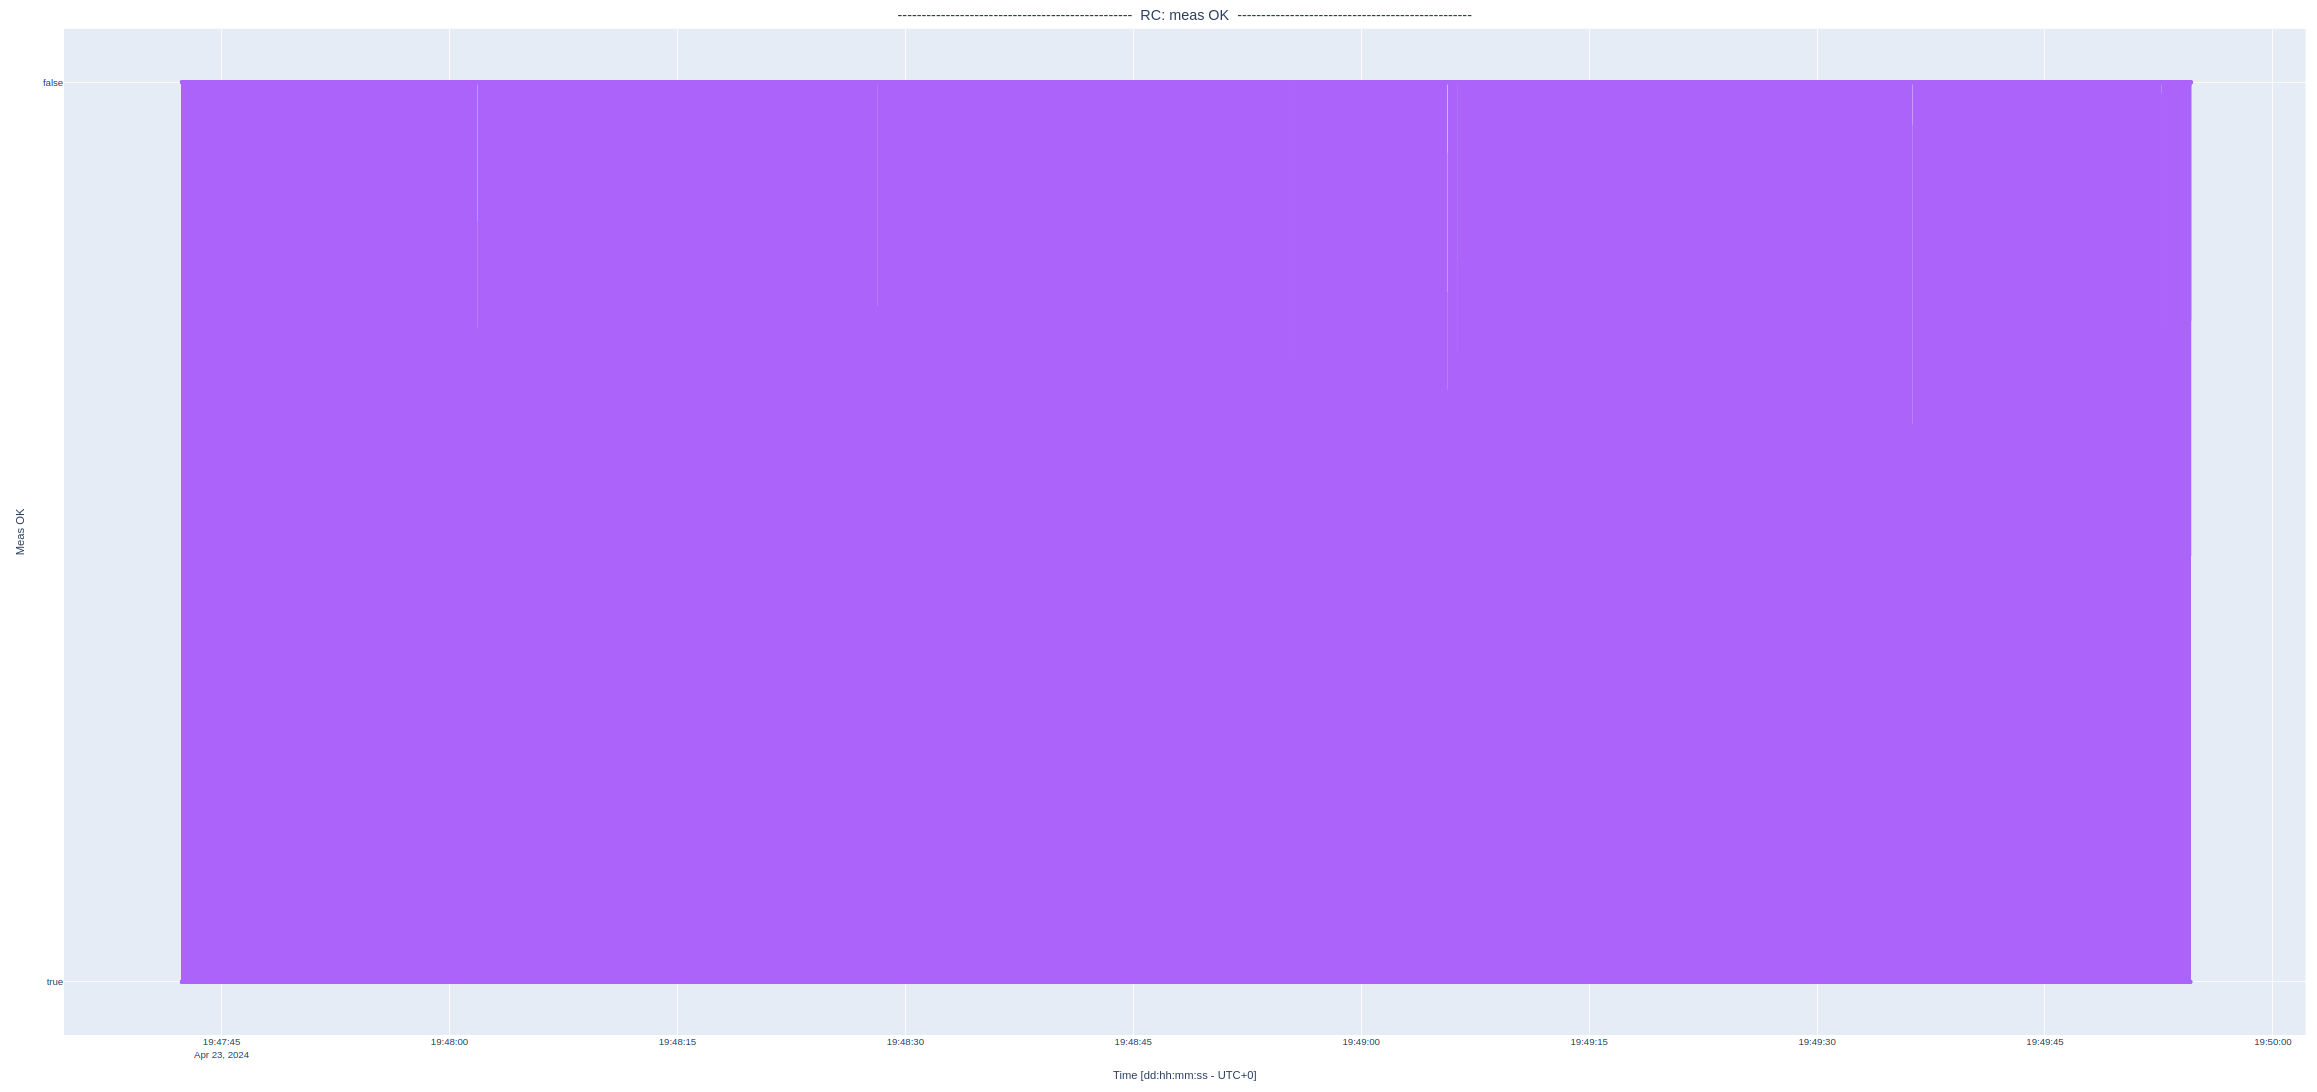
Fig 4: Measurement OK plot on a sensor with valid messages but wrongly populated field.
Lastly, when inputting wheelspeed measurements using the FP_B-MEASUREMENTS message, the corresponding frequency plot should present a constant frequency value. Some deviations are expected due to connection delays or high I/O load but should be minimal throughout the recording.
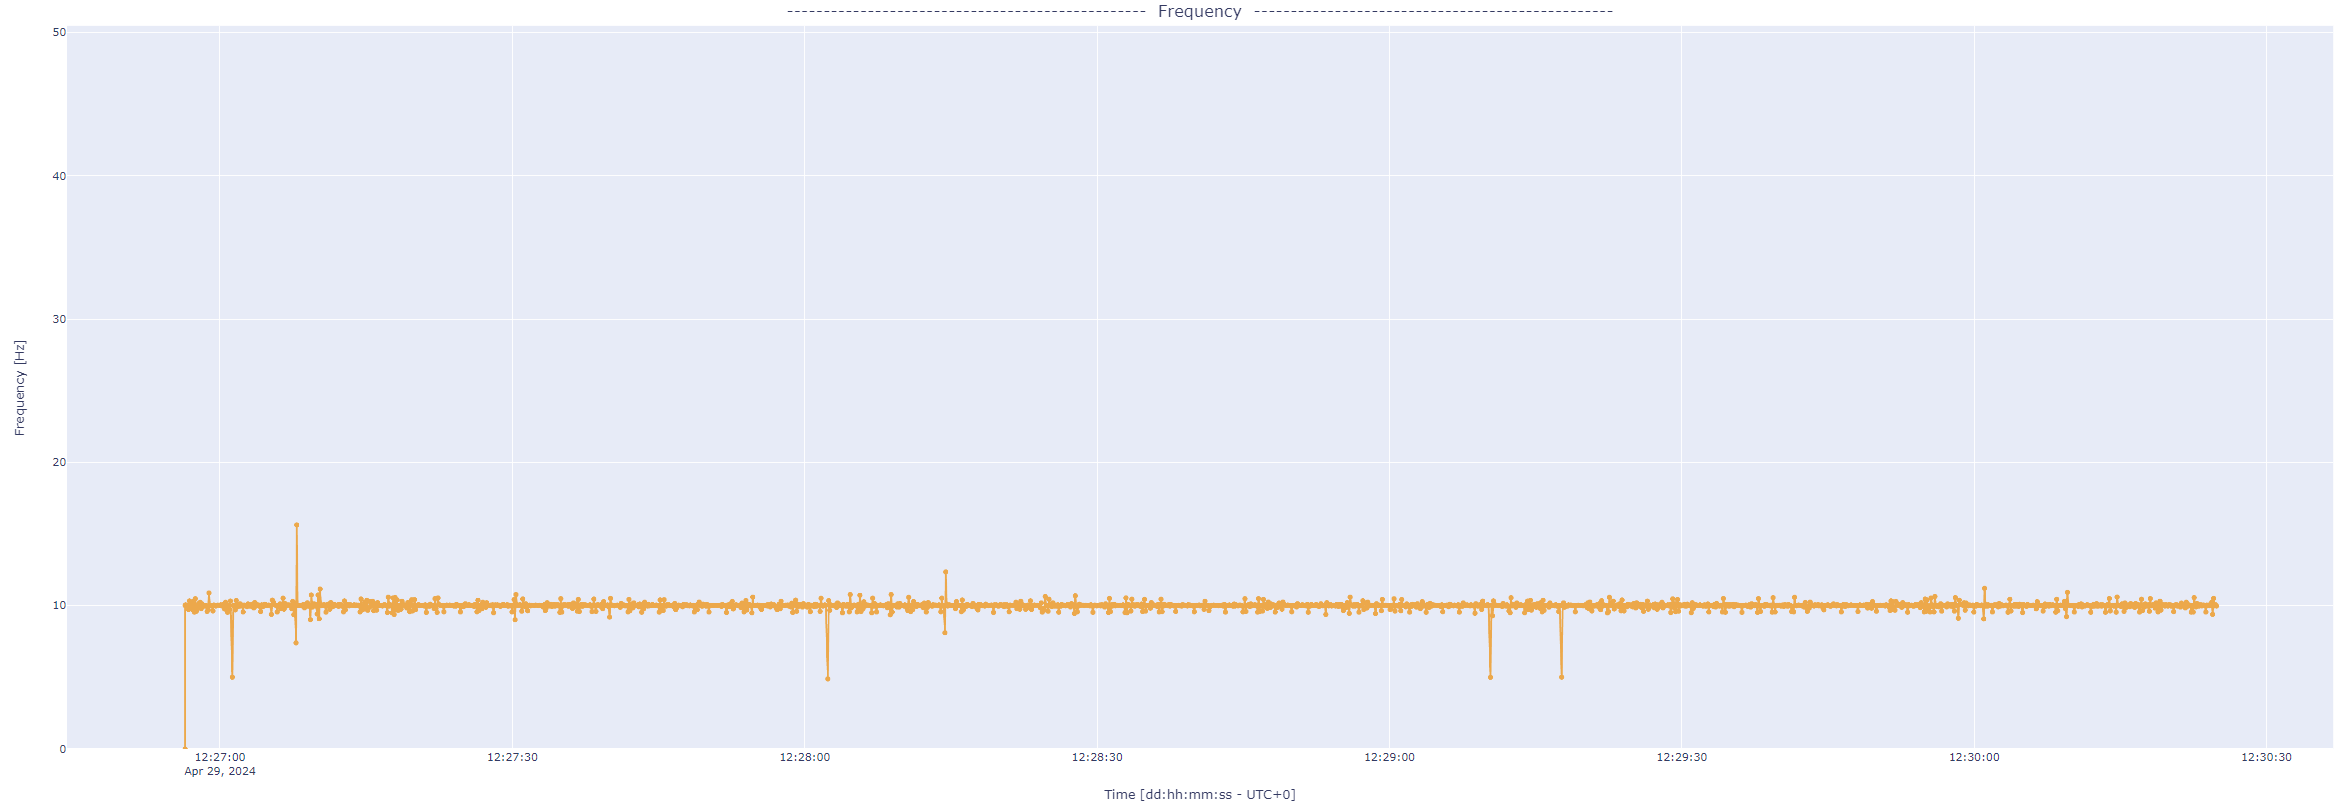
Fig 5: Frequency plot when inputting FP_B-MEASUREMENTS messages.
Example HTML:
Further analysis
If you repeatedly encounter wrong or missing wheelspeed measurements in this file, please contact the Fixposition support team at support@fixposition.com to identify possible error sources.
Verify the integrity of the wheelspeed messages and ensure the correct fields are populated.