IMU statistics (imu_stats)
Objectives
Ensure the linear acceleration and angular velocity values are within the supported ranges for the selected operation mode (e.g., car, generic, lawnmower).
Identify vibration sources impacting performance by analyzing the frequency response of the IMU.
Evaluate if the location of the Vision-RTK 2 on the platform is ideal.
Explanation
The IMU statistics file allows the user to evaluate the performance of the inertial measurements on the selected platform by analyzing its time and frequency domains. For ease of visualization, this file divides the measurements into two columns. The left column presents the temporal response of the IMU measurements collected throughout the recording, which include the accelerometer (i.e., linear acceleration in three dimensions) and gyroscope (i.e., angular velocity in three dimensions). The right column presents the respective frequency response of all measurements captured during the recording.
Fig. 1a: Accelerometer.
Fig. 1b: Gyroscope.
Time domain plots:
For the linear acceleration:
The sensor expects all values to be inside the supported range for the selected operation mode (e.g., ±40 m/s2 for 'generic'). The vibrations observed on the Z-axis are particularly interesting, as we expect to measure only the gravity vector (i.e., -9.81 m/s2) under ideal conditions.
Any other values correspond to vibration on the sensor's platform or the vehicle's dynamics. For the former case, isolating the sensor from external vibrations (e.g., combustion engine) is essential.
For the angular velocity:
The sensor expects all values to be inside the supported range for the selected operation mode (e.g., ±1.5 rad/s for 'generic'). If the observed angular velocities are outside the supported range, the chosen tuning mode might not be ideal, and the sensor might present degraded performance.
Moreover, the user can enable a reference computed using the estimated linear acceleration and angular velocity from the Fusion engine. Despite the slight impact of noisy vibration on the IMU, the Fused output acts as a highly accurate filter, ensuring reliable measurements.
To enable or disable an axis or group of measurements, simply click on the corresponding name on the file legend (e.g., Fusion reference measurements).
Frequency domain plots:
These plots allow the detection of vibrations caused by diverse elements on the platform, such as combustion engines, pumps, and hydraulics, among others. If there is a clear and recurrent response between multiple recordings, it might be necessary to isolate the Vision-RTK2 further or change its location on the platform. To facilitate detecting these vibration sources, the user can enable a reference trajectory generated by the frequency spectrum of all IMU measurements collected when the platform is stationary. This approach isolates the noise of the platform by eliminating the effects of motion in the IMU readings.
If isolating the Vision-RTK2 from vibrations or changing its location is not feasible, please get in touch with support@fixposition.com for further guidance on the matter.
Expected results
1. For the temporal response:
All values for the linear accelerator and angular velocity in all axes should be inside the supported range for the selected operation mode.
Assuming the sensor is parallel to the ground in stationary conditions, only the Z-axis should be non-zero and present a value close to the gravity vector. If the sensor is tilted, the norm of the forces should be equal to the magnitude of the gravity vector.
The IMU measurements should not differ significantly from the Fusion reference measurements. The overall 'shape' of the measurements should be similar in both plots.
2. For the frequency response:
The cause for observing peaks in the frequency spectrum depends on the conditions in which the recording was performed:
If the engine is off and the vehicle is stationary: An active component is likely causing vibrations on the sensor, or the platform is not rigid enough.
If the engine is on and the vehicle is stationary: The sensor is likely located above an active component (e.g., the engine) and not adequately isolated from it. Use some dampening mechanism or change the location of the sensor.
If the engine is on and the vehicle is moving: When the vehicle is moving, the IMU will be excited by the vehicle's dynamics. However, if clear peaks in the frequency spectrum do not correspond to the velocities in which the vehicle was displacing, then proceed to perform stationary tests to discard effects from the motor or the structure. The reference measurements can serve to isolate this in some scenarios.
Examples
IMU performance on a car: All IMU values are inside the expected range for the 'car' operation mode, and there is no clear indication of external vibrations affecting the sensor.
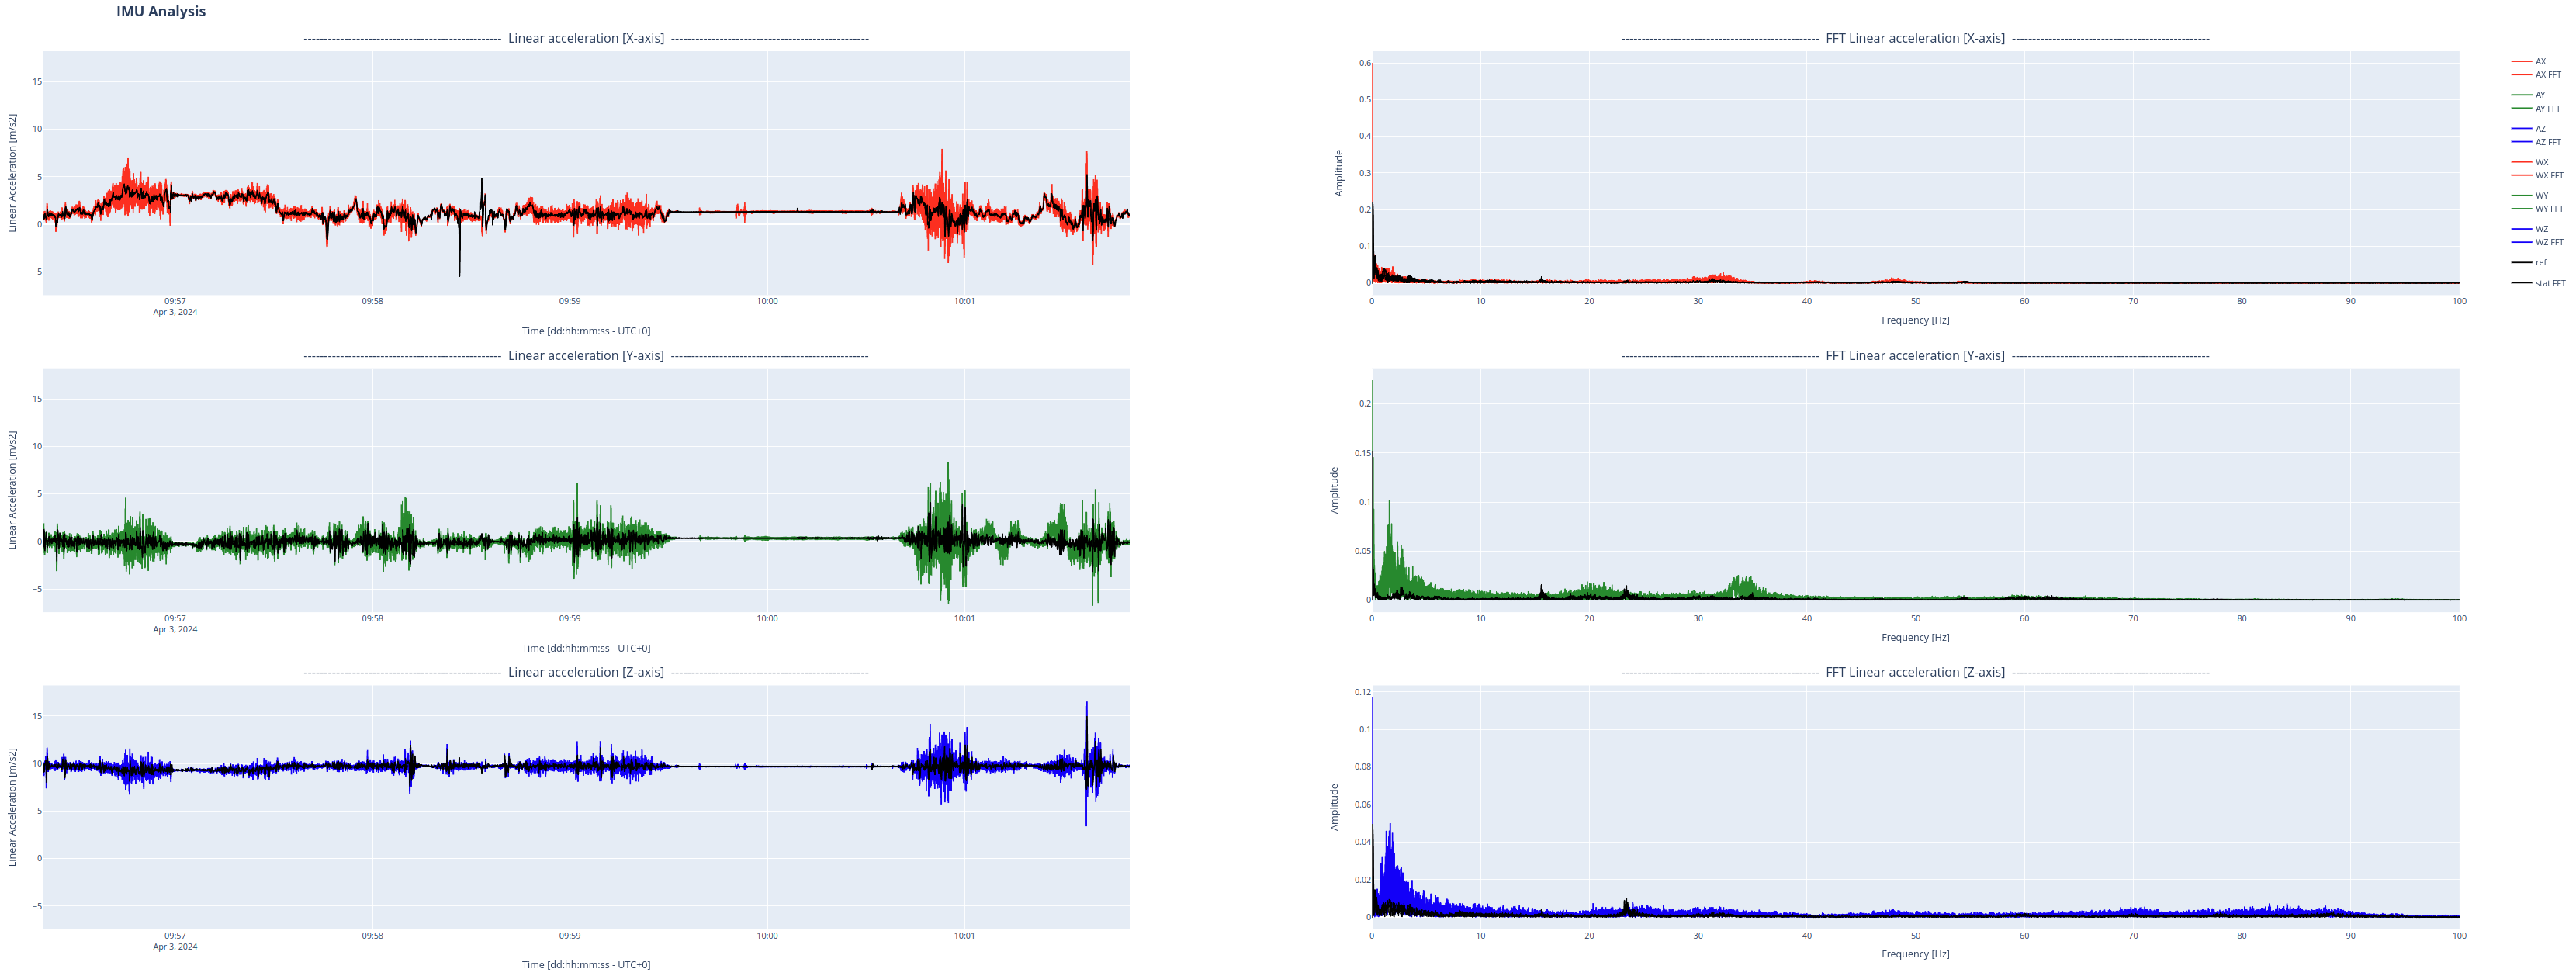
Fig. 2: Good IMU performance on a car.
Example HTML:
IMU performance on a tractor when stationary: All IMU values are within the expected range for the 'lawnmower' operation mode. However, there is a clear indication of external vibrations on the frequency response of all axes on the linear acceleration plot, with the most notable frequency peaks at 30 and 60 Hz. Furthermore, a noticeable difference between the IMU measurements and the reference values suggests a deviation in the IMU performance.
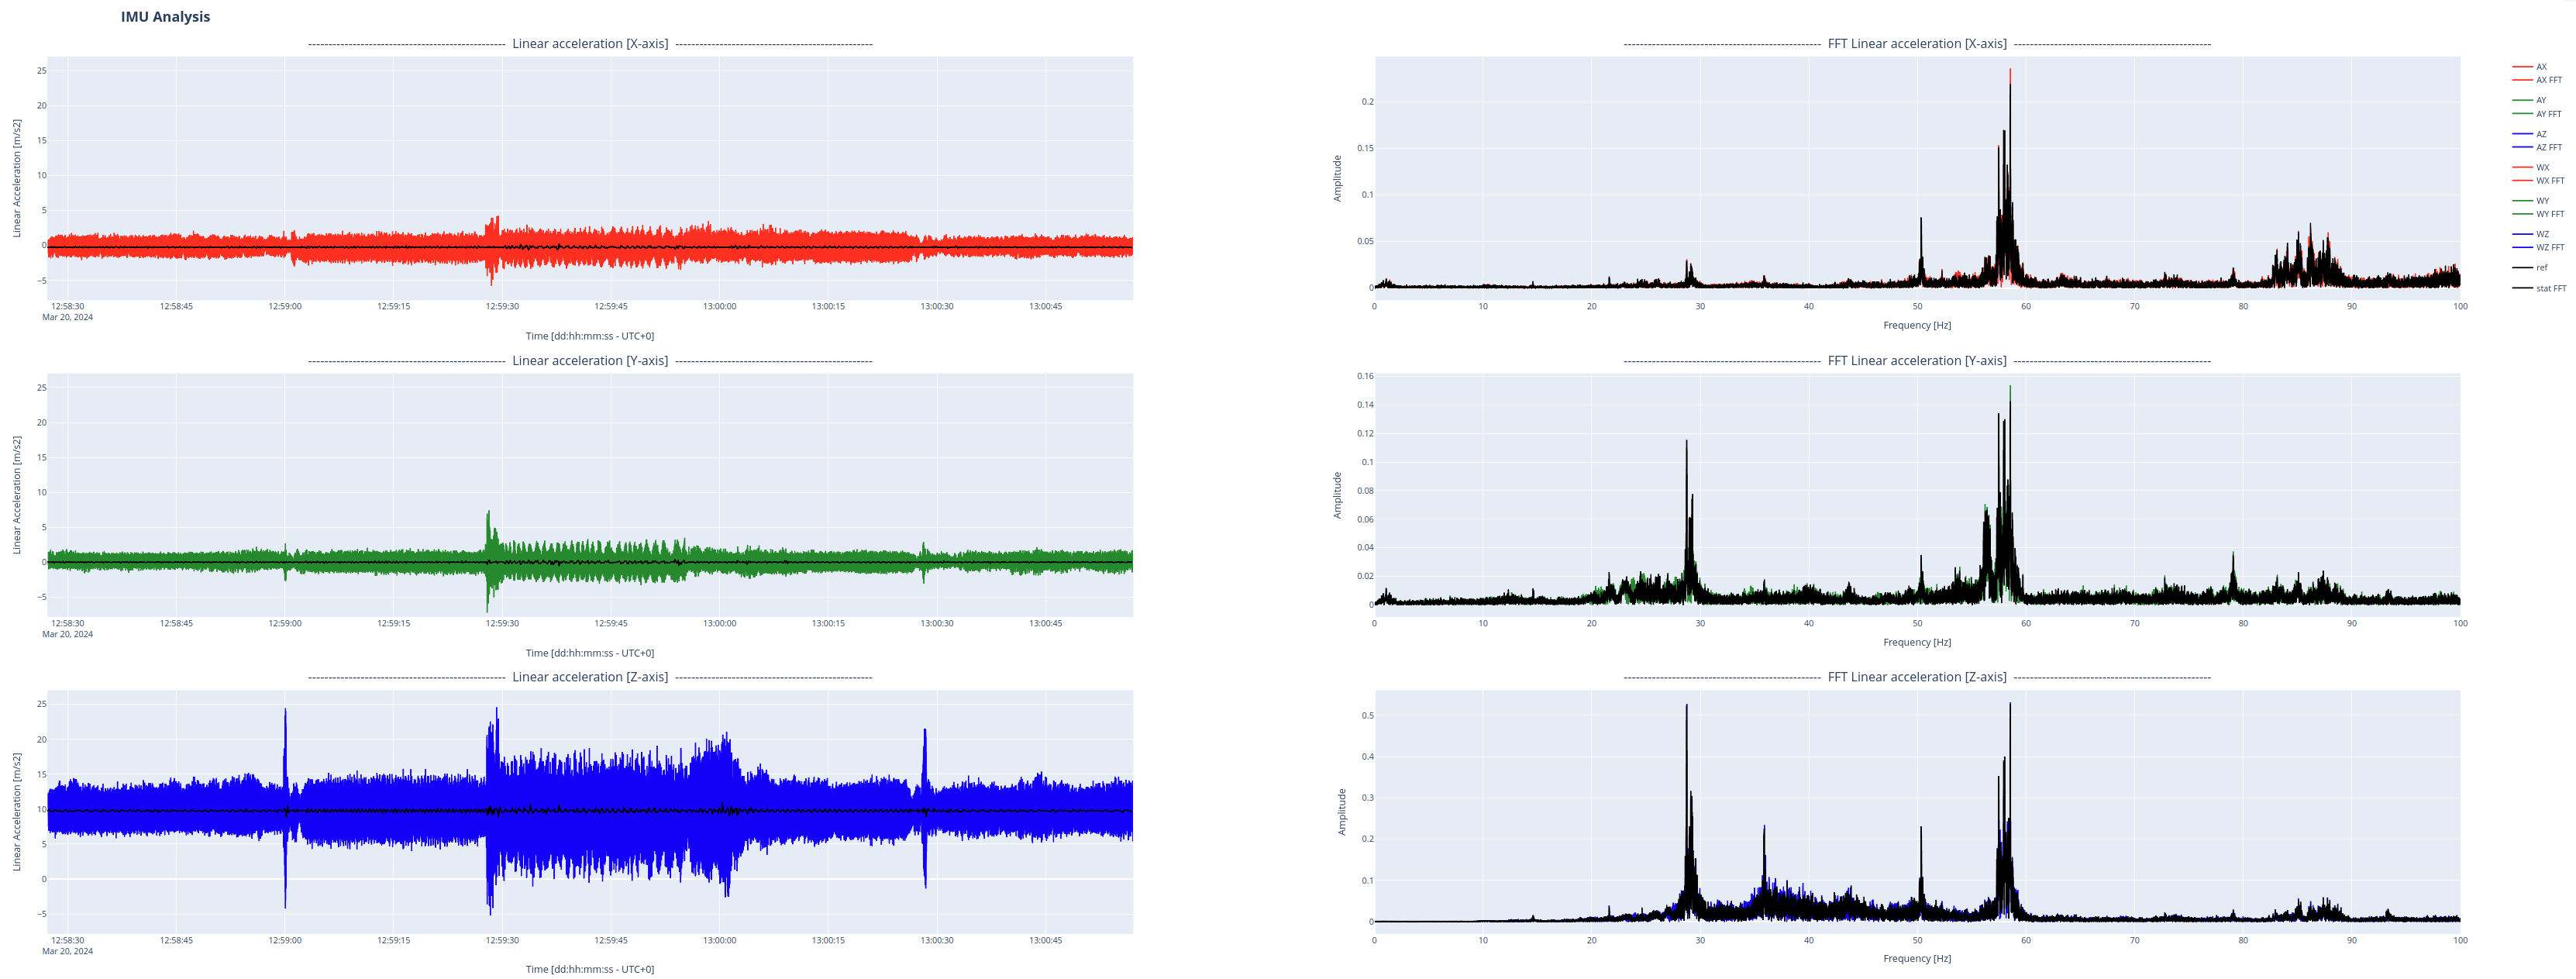
Fig. 3: Degraded IMU performance on a tractor.
Example HTML:
IMU performance on a tractor when moving: When looking at the IMU frequency spectrum, it can be tricky to observe any significant noise, as shown in Fig. 4a. However, we can better distinguish the vibrations produced by external factors by isolating the IMU measurement when the platform is stationary, as shown in Fig. 4b. In this case, we can see frequency peaks at 30 and 60 Hz.
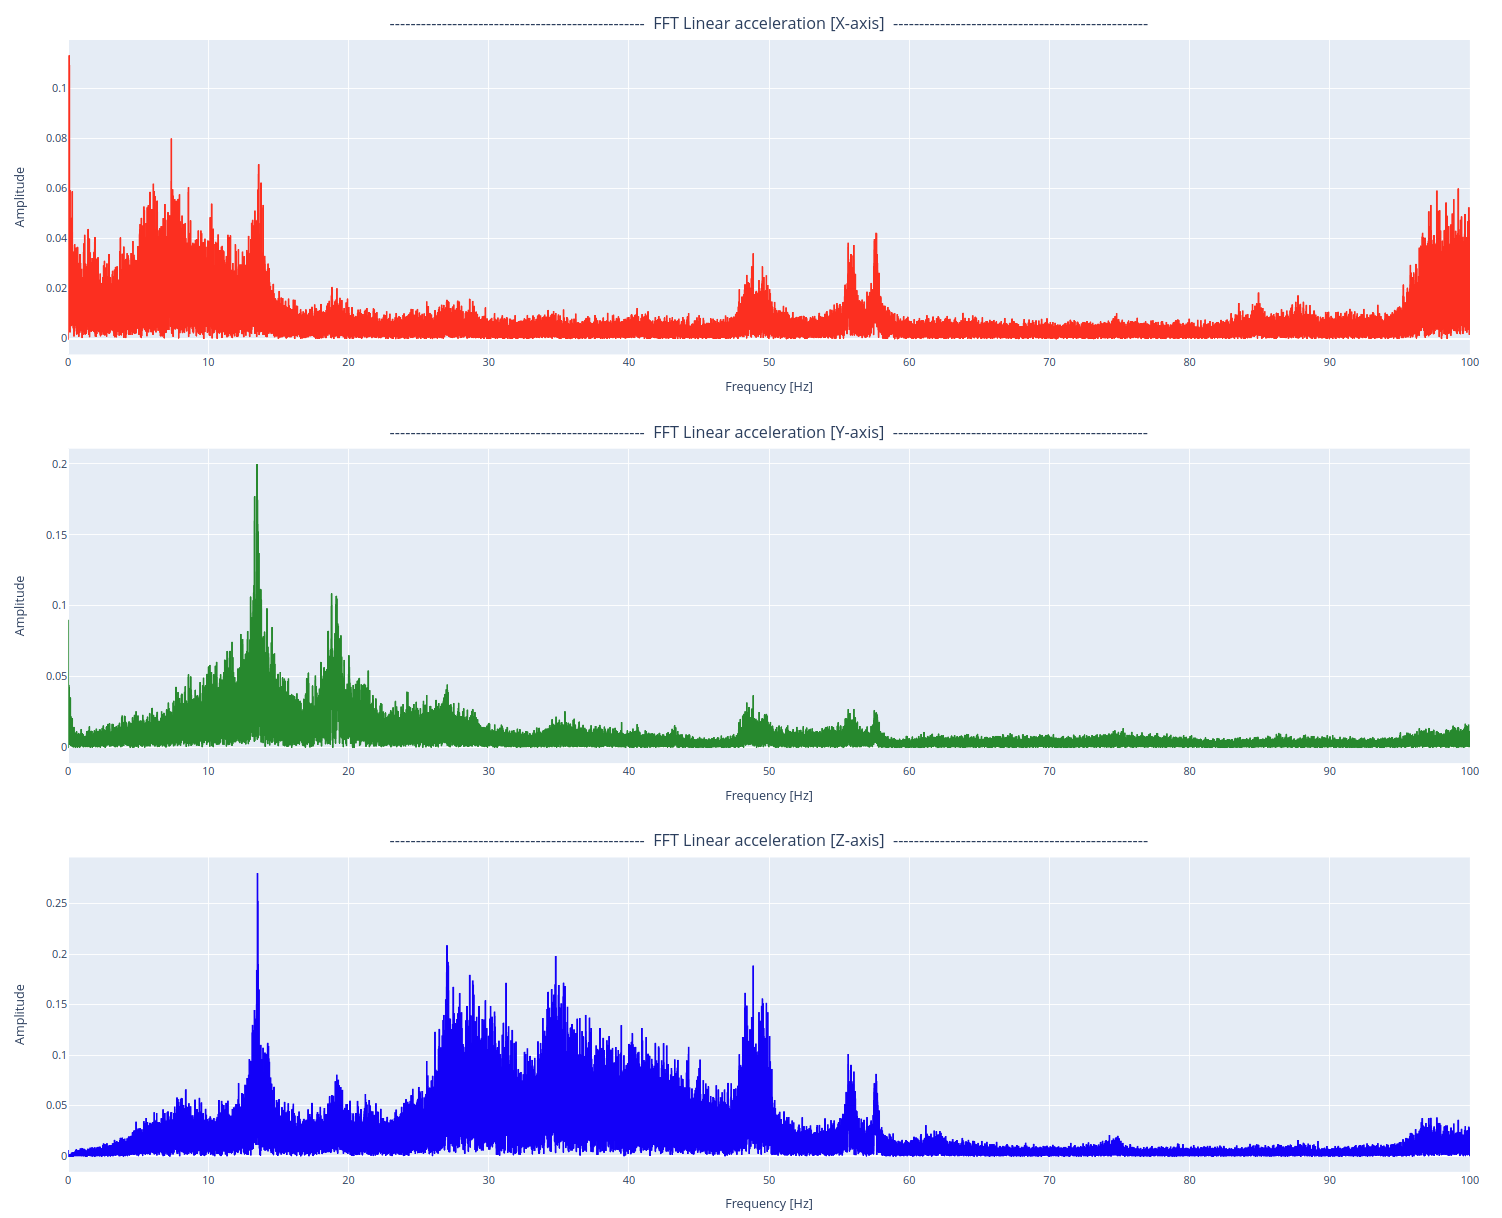
Fig. 4a: IMU frequency spectrum.
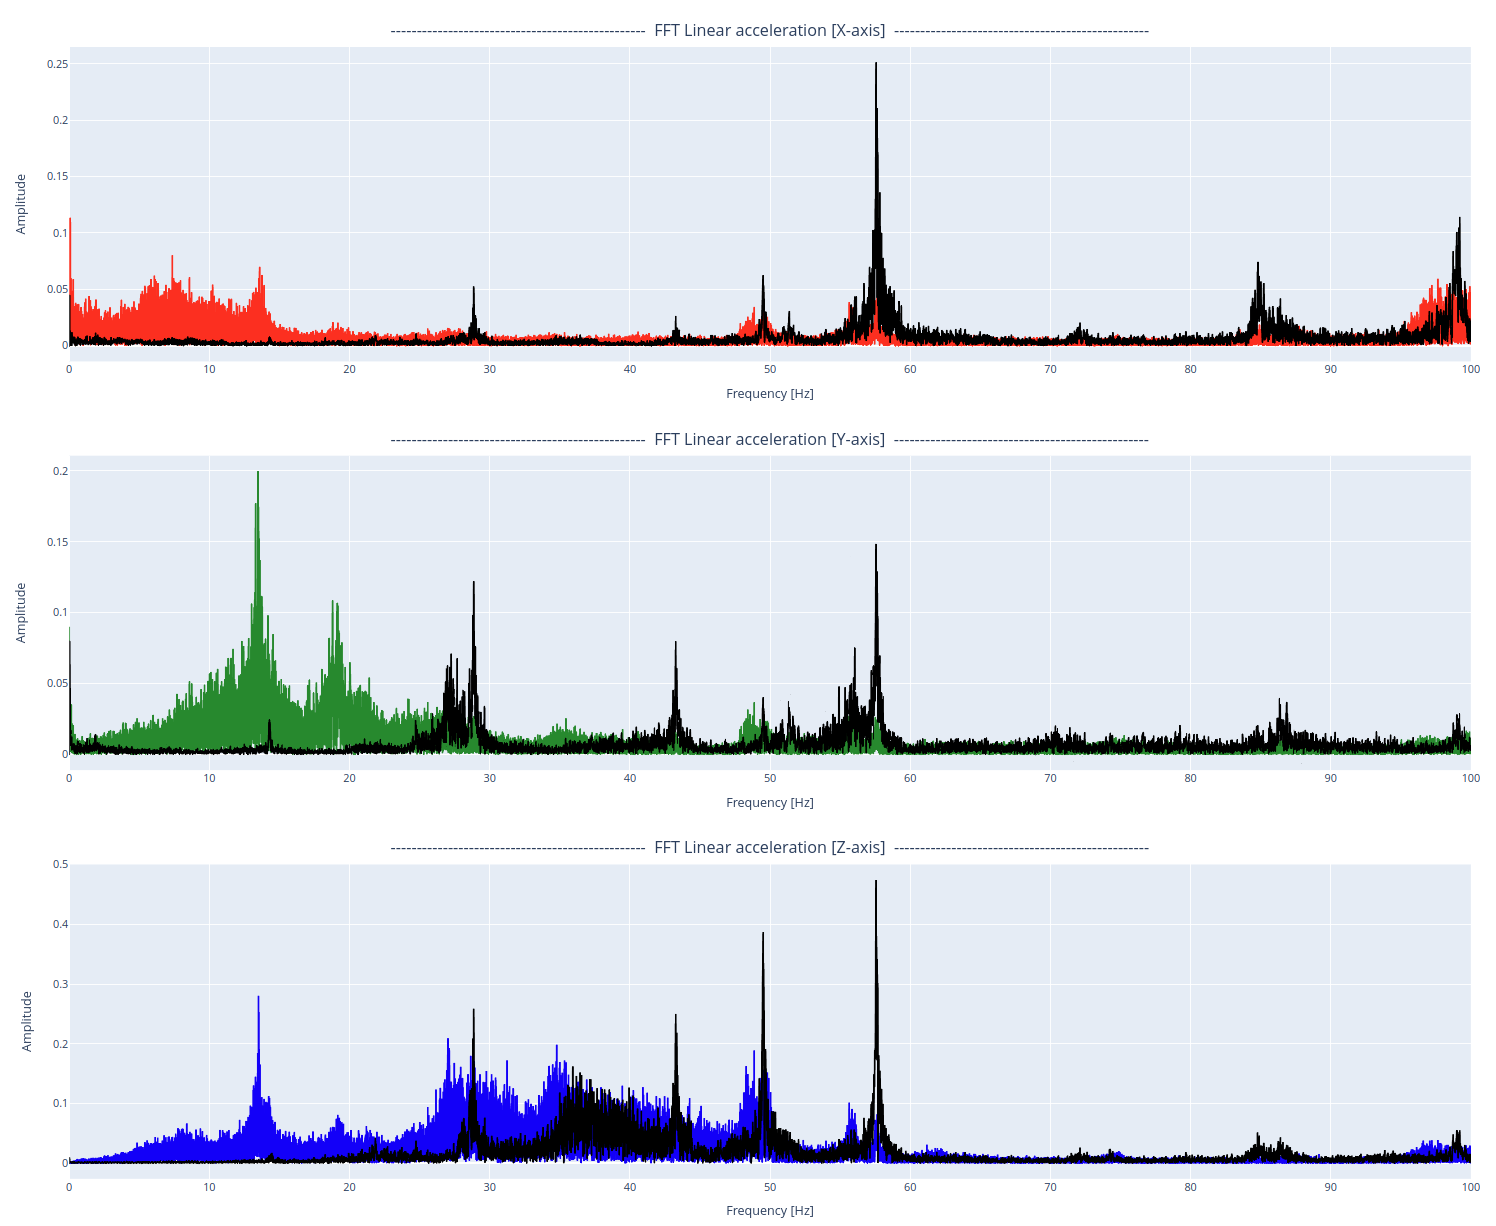
Fig. 4b: Stationary frequency spectrum.
Example HTML:
Further analysis
Make a 'Medium' recording with the vehicle stationary for about 5 minutes with the engine off.
Make a 'Medium' recording with the vehicle stationary for about 5 minutes with the engine on.
Make a 'Medium' recording with the platform moving at a low throttle.
Make a 'Medium' recording with the platform moving at a high throttle.